Blackpool Are Back!
Well-known member
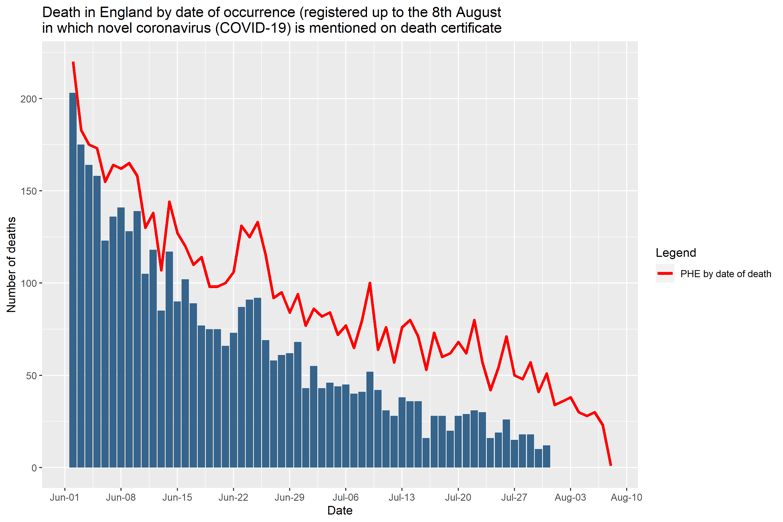
Looking a lot more positive now, isn't it?
Last edited:


maybe they should count the number who died as a direct result of covid - just a thought.Using the historical method the average is 62 per day.
Using the new 28 day cut-off from test reporting the average is 11 per day for the last week. For the previous 7 days the average was 8 per day so deaths are actually increasing by this method.
Using a 60 day cut-off from test the average is 22 per day.
Pick your method of reporting.
Using the historical method the average is 62 per day.
maybe they should count the number who died as a direct result of covid - just a thought.
by only including where there was no other primary reason, e.g. being hit by a bus.How do you define that?
All 3 methods above include deaths only where there has been a positive test for Covid-19.by only including where there was no other primary reason, e.g. being hit by a bus.
From day 1 doctors were instructed to put covid on the balance of probabilities without even testing.
moving the goalposts all the time is a joke- no one really knows the UK impact and whether the crippling measures introduced were necessary, and whether the current measures should be fully eased.
and if that's not the primary cause you're ok with it being classed as covid death?All 3 methods above include deaths only where there has been a positive test for Covid-19.
and if that's not the primary cause you're ok with it being classed as covid death?
Think we'll agree to disagree.
How many people have died of cancer because they couldn’t get treatment as we were protecting the NHS?
whilst it was from the April / May it looks legit. Any reason to believe it isn't?'From day 1 doctors were instructed to put covid on the balance of probabilities without even testing. '
I am saying that what you stated was incorrect.
But those deaths are not included in the daily figures quoted above or in the daily reporting since the beginning of the pandemic.whilst it was from the April / May it looks legit. Any reason to believe it isn't?
Using the historical method the average is 62 per day.
Using the new 28 day cut-off from test reporting the average is 11 per day for the last week. For the previous 7 days the average was 8 per day so deaths are actually increasing by this method.
Using a 60 day cut-off from test the average is 22 per day.
Pick your method of reporting.
Add to that the weekly ONS analysis of death registration and the ONS periodic review of excess deaths. They all tell a story and give useful information but you do need to understand the method of accounting (and their pros and cons).Sponsored by Confused.com
 www.cebm.net
And pre-June PHE were under reporting deaths (when compared with ONS death registration data) due to Covid-19 as the daily reporting required a positive test. Since June there has been over reporting due to deaths due to other reasons following a positive death (hence the introduction of 28 days and 60 days cut-off reporting).So you can see as far back as the beginning of June PHE were misreporting deaths and the disparity has got wider and wider week on week and continues to do so.
I just can’t wrap my head around some people on here. Some just seem to thrive on negativity and just cant see or refuse to see anything positive at all.
Spot on Scaramanga. Angry, fake socialists just lashing out at anything. So negative.I just can’t wrap my head around some people on here. Some just seem to thrive on negativity and just cant see or refuse to see anything positive at all.
I was going to say, the 7 day average shows a slight increase for both infections and deaths. The danger is people will just switch off and things get worse.Using the historical method the average is 62 per day.
Using the new 28 day cut-off from test reporting the average is 11 per day for the last week. For the previous 7 days the average was 8 per day so deaths are actually increasing by this method.
Using a 60 day cut-off from test the average is 22 per day.
Pick your method of reporting.
The worst mistake we've made is calling it a strain of flu. It's not and that leads to a false sense of security, especially among those who claim time off work every year with flu, when they've got a mild cold.Indeed this is good news and hopefully will continue to drop in the coming days.
I also hope that the increase in cases is picking up a mutated Coronavirus strain (akin to the summer cold) which is less debilitating and less lethal.
I agree but ultimately Coronavirus is a cold virus. So a mutated strain could be showing positive to tests but it might not be full blown CV19.The worst mistake we've made is calling it a strain of flu. It's not and that leads to a false sense of security, especially among those who claim time off work every year with flu, when they've got a mild cold.
It is - so may be a contributory cause rather than primary cause.Isn't the ONS figure where Covid is "mentioned" on the death certificate. i.e. it may or may not be the primary cause.
